In order to manage the 1000’s of barcodes we utilize a system of Minimums and Maximums. We update these Mins/Maxs every quarter. This allows us to adjust for things we are starting to use more of (by increasing the maximums) and things we are starting to use less of (decreasing the maximums).
The minimum is the least amount of products we need on the shelf and it’s also used as a trigger to order more. The maximum is the most we should have of any product.
Maximum = What we should have on the shelf
Minimum = Set to 1 less than the maximum, this triggers Phorest to “Order to the max”, replacing every product every time.
Back Bar = 1 month of supply
Retail = 2 months of supply
Always run the report for the last 3 months to give you the 3-month average usage and follow the steps below to let excel auto calculate every single line item for you.
How to Export Product Usage Report into Excel #
Open Phorest

Click “Manager”
Click “Reports”

Click “Additional Reports”

Select Products Category
Select Product Usage (BackBar)
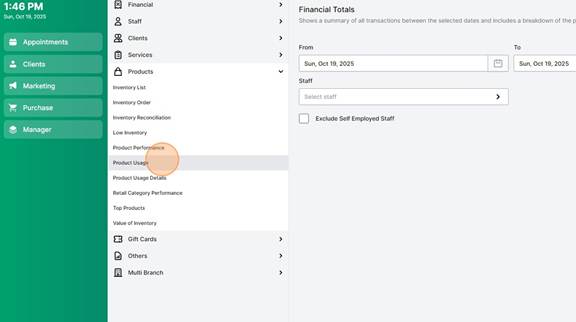
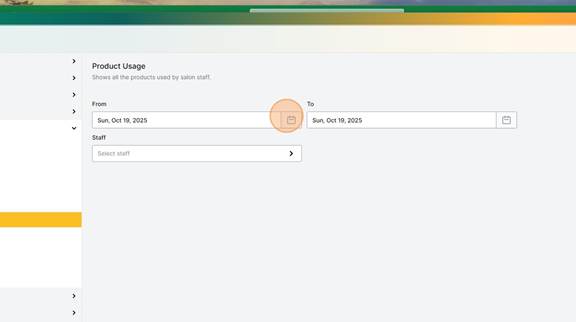
Select the Date Range (Last 3 Months)
Click Generate Report

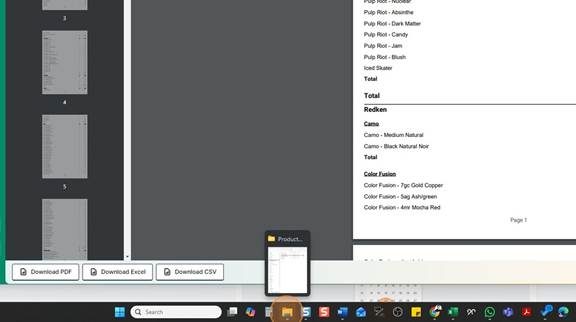
Export to Excel or CSV
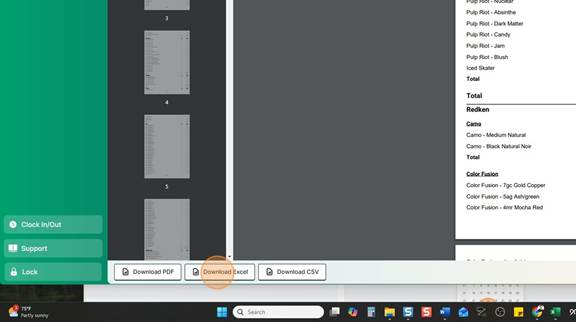
Save to “Downloads” or “Desktop” – To Find it Easily
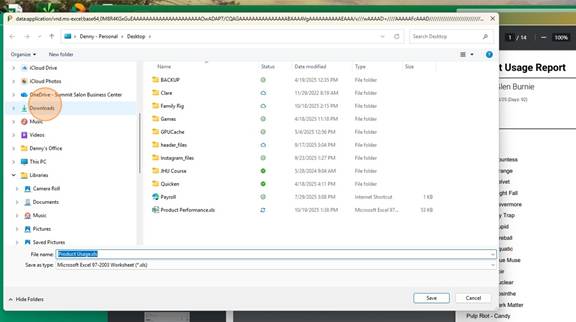
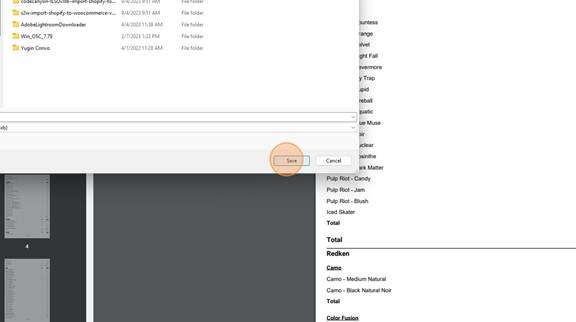
Rename the Report (Optional) – Click “Save”
Open File Explorer
Select Saved Location

Double-click File name

Click “Enable Editing”
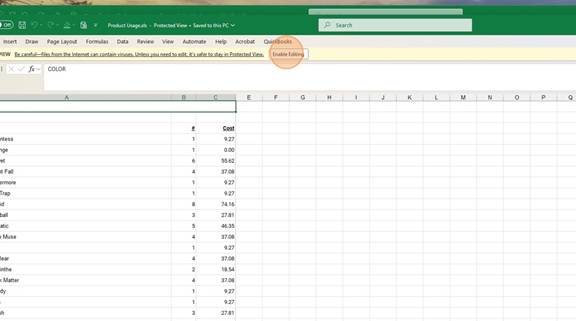
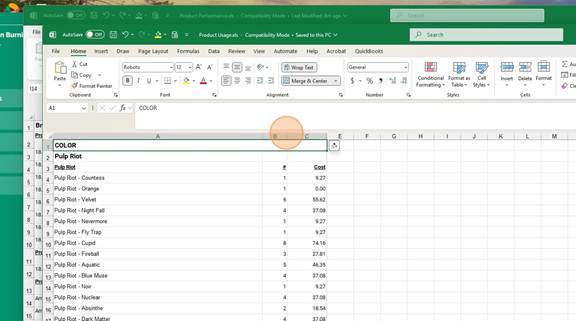
Expand Name Column to See Everything
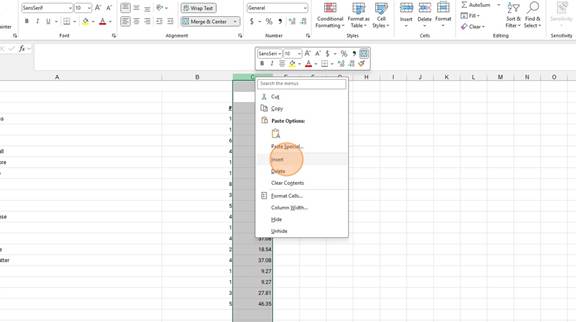
Right Click The Column to the Right of the Quantity Column and Click “Insert”
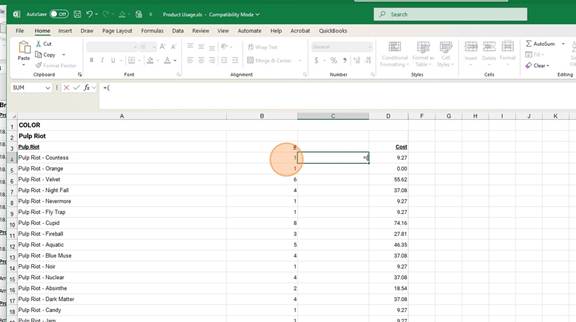
Formulas always start by Typing in an “=” sign
The click the cell you want in the formula (Quantity)
Dividing by 3 gives you the 3 month average
=(B4/3)*1 (BB 1 Month Supply)
=(B4/3)*2 (Retail 2 Months Supply)
Enter Formula: =(Cell/3)*1
Click “Decrease Decimal” to two places .00
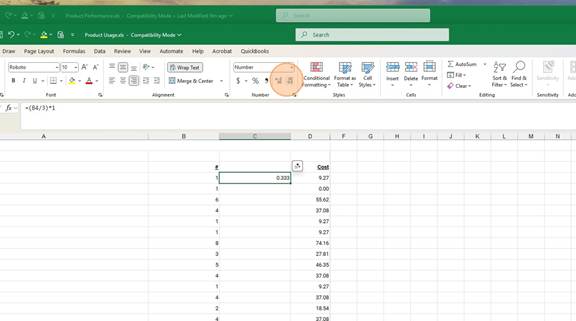
Click bottom right green box and drag to the bottom of the column
Now you have the Maximums for every product!
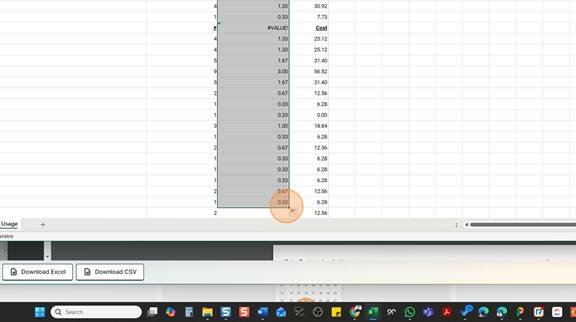
Minimize Both windows and line them up side by side
PRO TIP – It’s easy to do a full line at a time. Export all of Color Fusion then Select the Category Color Fusion and update the whole line at one time.
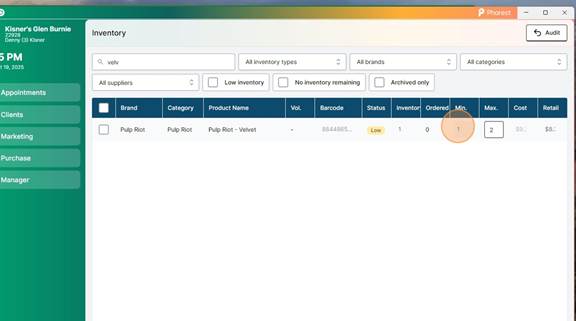
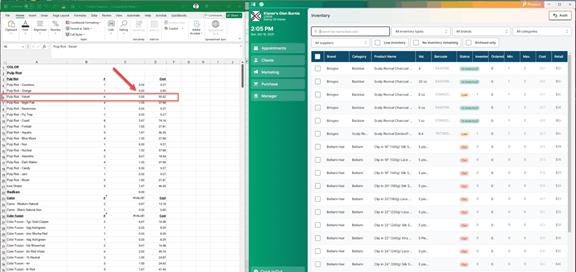
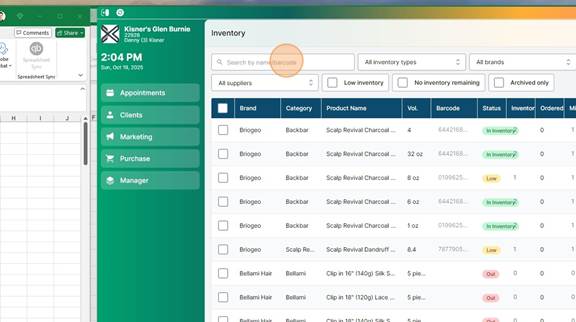
Manager > Inventory > Select Filters or Use Search
Enter 1 or 2 month supply number in “Max” column

Subtract 1 and enter that number in the “MIN” column